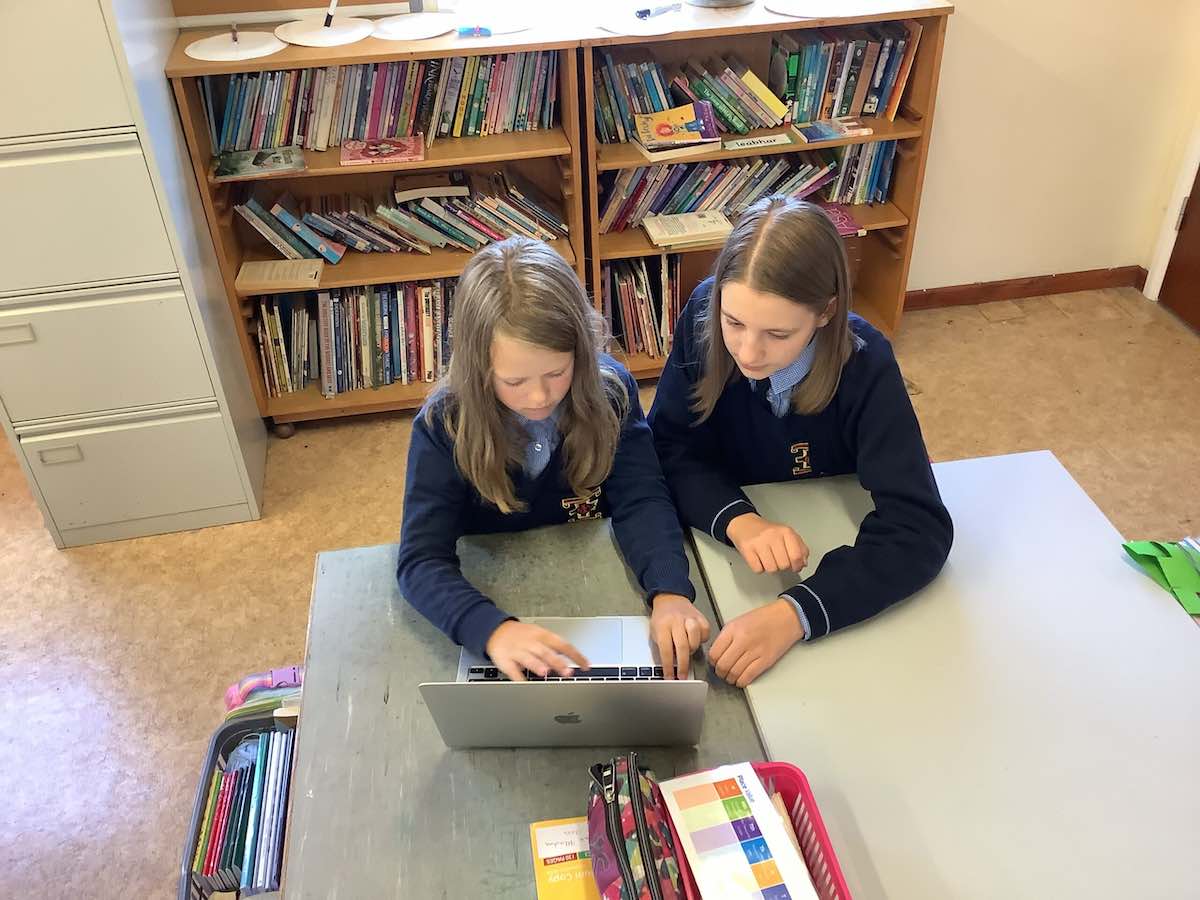
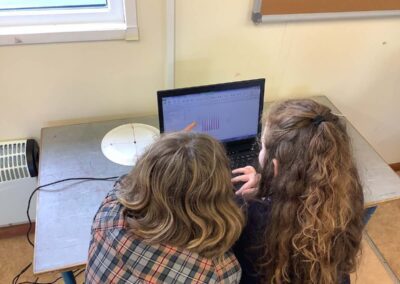
The girls explored the advantages of using technology to create graphs/charts for their data.
What would usually take up to 20 minutes to do manually in their copies was achieved in a matter of moments when using a spreadsheet application.
The girls created pie charts, bar charts and multiple bar charts using the software on the MacBooks / laptops.

